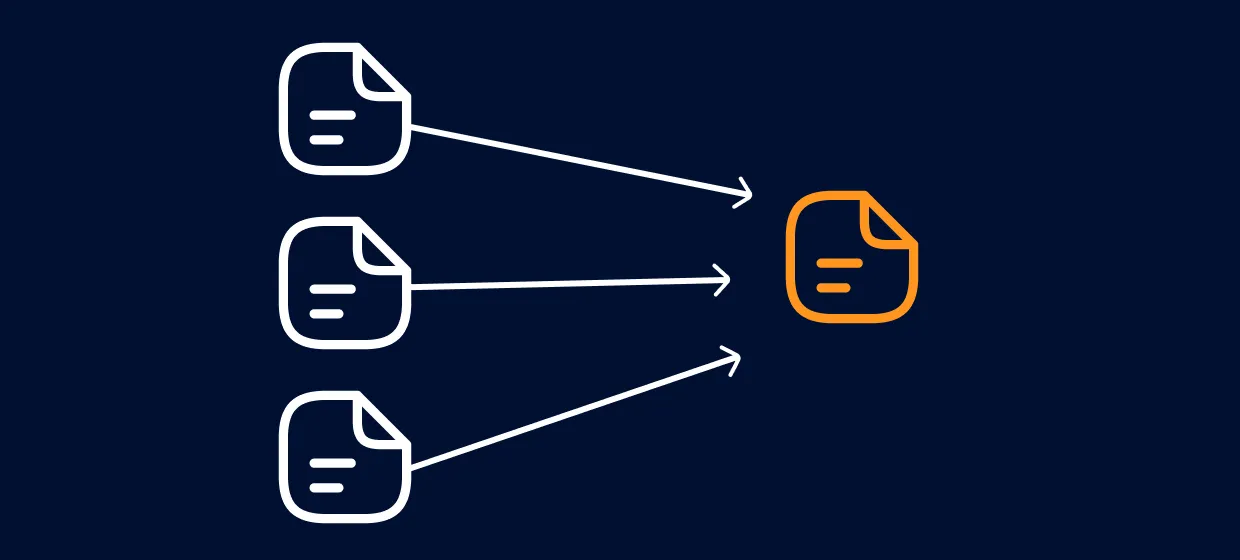

Data aggregation is the process of gathering raw data from multiple sources, cleaning and standardizing it, and combining it into a single dataset you can analyze. The sources range from internal databases and public APIs to web pages, log files, and feeds. The goal is the same in every case: turn scattered data points into one structured view that supports reporting, pricing decisions, research, or forecasting. Done well, aggregation is the step that converts raw data into the statistical analysis, trend analysis, and valuable insights a team can act on.
For anyone pulling from external web sources, a data aggregation project rarely stalls at the analysis step. It stalls at collection.
Three problems show up again and again. Data goes stale because sources update faster than you re-pull them. Responses come back incomplete, so a job runs to completion but returns half the rows you expected, and nobody notices until the numbers look wrong. And data is market-specific: prices, listings, and availability differ by country, and a single connection only ever sees one version. Each of these quietly erodes data quality, whether you are aggregating sales data from retailers, public posts from social media platforms, or signals on customer behavior across channels. Aggregated data is only ever as good as the collection behind it.
Rate limits make all three worse. Most public endpoints cap how many requests a single IP can make in a window. Reddit's official Data API, for example, allows 100 queries per minute per OAuth client ID, averaged over a 10-minute window, and rejects traffic with no credentials entirely. One machine on one IP making thousands of requests gets throttled within minutes, and the responses you do get back are the ones most likely to be incomplete.
This is where proxies earn their place in a data aggregation pipeline. A proxy routes your requests through a pool of separate IP addresses, so each individual IP stays within a source's per-IP limits while your overall throughput goes up. Proxies located in a specific country also let you collect market-specific data, so you can compare a product listing as it appears in Germany, Japan, and the US in the same run. For most real-world data collection workflows, getting the collection layer right is the difference between a dataset you can trust and one full of quiet gaps.

Match the proxy type to the source: datacenter proxies for high-volume public data, residential and ISP proxies for consumer-facing or session-bound sources, and mobile proxies for mobile-first platforms. Using one type for everything either overpays on the easy sources or underperforms on the hard ones.
Here is how the main data sources line up with proxy types:
One practical advantage of running these on a single account is that you can prototype on rotating residential, then move the same job onto static or ISP proxies as it grows, without onboarding a second vendor. Pay-as-you-go billing on the rotating lines means you only pay for the bandwidth a job actually uses.
Diagram: matching common data sources to the proxy type best suited for collecting from them.

Not every source needs a proxy. Sorting sources into tiers before you write a single collector keeps costs down and reduces how much you have to maintain.
The mix is what controls your spend. In a large aggregator pulling from hundreds of sources, the majority can often come from feeds and APIs, with proxy-backed collection reserved for the remainder. Fewer proxy-backed requests means lower bandwidth costs and fewer parsers to repair when a site changes its layout.
Once your sources are tiered and matched to proxy types, the data aggregation pipeline itself follows a consistent shape.
For most data aggregation projects, a sensible starting point is rotating residential for the consumer-facing sources and datacenter for the public ones, then adding ISP or static residential as your sessions get longer. Proxy-Cheap runs every one of these proxy types on pay-as-you-go billing with no monthly commitment, so you can size your spend to each job and cancel anytime. Datacenter proxies are a low-cost place to start testing a collector before you scale it onto residential or ISP lines.
Collecting the data is half the job. The other half is turning what you pulled into clean, aggregated data that analysts can use to analyze data, and this is where the data aggregation process earns its name.
A typical data aggregation process runs in a few stages. You start by gathering raw data from each source, which arrives in different shapes: structured records from APIs, semi-structured feeds, and unstructured data from web pages and log files. Data cleaning removes duplicate raw data and fixes malformed rows. Data transformation maps every source onto one common schema so the fields line up. Then comes combining data from multiple sources into a single dataset and organizing data by the keys you will query later. Pulling data from multiple sources is what makes standardizing formats early matter so much. Only after that does it make sense to summarize data into the metrics that matter: counts, sums, averages, and maximum values that roll many single data points into a few numbers. Data aggregation compresses thousands of data points into figures a person can read.
Skipping the cleaning and transformation stages is the most common reason aggregated data turns out wrong. Two retailers might label the same field differently, or report prices in different currencies. If you combine data from diverse sources without standardizing it first, your statistical analysis inherits every inconsistency. Strong data quality at this stage is what makes the downstream data analysis of your aggregated data trustworthy.
Most data aggregation tools focus on what happens after collection. Business intelligence suites, cloud based data warehouses, and even Microsoft Excel are built for data storage, modeling, and visualizing data you already have. They power interactive dashboards, feed CRM systems, support day-to-day data management, and let marketing teams create reports and analyze data without writing code.
That is useful, but it leaves a gap. These software platforms assume the data is already in hand. Automated data aggregation tools can schedule a pull from an API or a database, yet most stop short of the messy part: collecting at scale from public web sources that limit requests by IP. Manual aggregation, copying figures into a spreadsheet by hand, does not scale past a handful of sources. The collection layer, and the proxy type behind it, decides whether your data warehouse and data storage fill up with complete data or only partial data.
In practice, teams pair the two. Proxies and collectors handle reliable, large-scale gathering from the open web. Data warehouses, data analytics, advanced analytics, and machine learning algorithms then turn that aggregated data into predictive analytics, trend analysis, and the valuable insights leaders act on. For data science teams, the quality of the data aggregation directly limits the data analysis their data scientists and big data models can do.
With the collection layer handled, data aggregation itself usually falls into one of three computational patterns. The common types of data aggregation differ by what they group and over what window, and each exists to provide statistics, the averages, sums, and counts that compress many records into a few numbers.
Data aggregation can be manual, where someone compiles a spreadsheet by hand, or automated, where software collects and summarizes large datasets on a schedule. Time aggregation, spatial aggregation, and attribute aggregation are the three core types of data aggregation, and many tools let you combine them over custom time intervals or a specified time period. Most ongoing projects automate it, because the value of aggregated data depends on how fresh and complete it is.
The everyday examples are familiar once you know the pattern. Price comparison sites aggregate product listings from many retailers. Travel aggregation tools pull fares and availability from airlines and booking platforms into one view. Market research teams combine pricing, review, and availability data to size a market. All three depend on collecting from sources that differ by region, which is exactly the case where the proxy type you choose, covered in the guide to proxy types, affects how complete your dataset turns out.
The payoff is the same across use cases: data aggregation lets a team gain insights it could not see in any single source. Retailers combine customer data to read customer behavior and customer satisfaction across channels. Analysts feed predictive analytics and machine learning algorithms with consistent data points. In healthcare, aggregating patient information supports population-level data analysis. Local business listings rely on data aggregators that compile names, addresses, and hours from many records and provide insights to the directories downstream. Whatever the field, the value of data aggregation tracks how complete and current the underlying aggregated data is.
Reliable data aggregation and responsible data aggregation are the same practice over the long run.
Collect publicly available data, and review each source's terms of use and robots directives before you pull from it. Pace your requests so you are not straining the servers you depend on, since a source that stays healthy is one you can keep collecting from. When your dataset includes personal data, handle it in line with the data privacy and data protection requirements that apply in each region, and keep transfers private; Proxy-Cheap routes traffic over 256-bit SSL. Treating the sources and the aggregated data with care protects your project, your data quality, and the broader ecosystem it draws on.