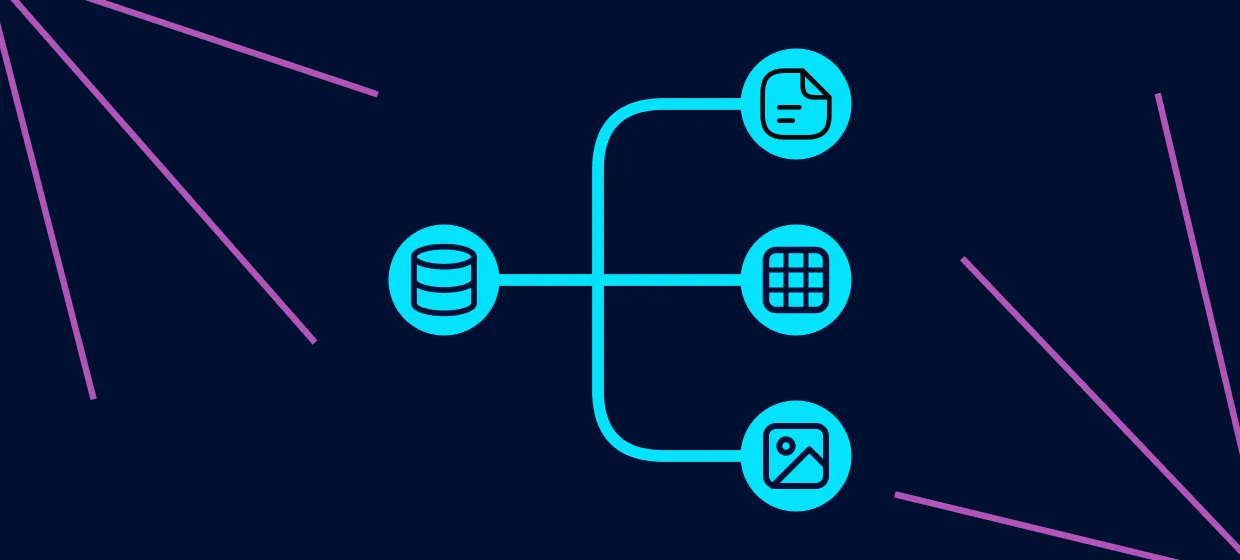

A dataset is an organized collection of related data points that are stored together and treated as a single unit for analysis or model training. Most datasets are arranged in rows and columns, where each row is one record and each column is one attribute. Others hold unstructured files such as images or audio.
That's the short answer. The rest of this page shows what separates a dataset from a random pile of data, and how teams build their own from public web pages.
Key takeaways
A dataset is a structured or unstructured collection of related data points that belong together and are used for analysis or modeling. In a tabular dataset, each row is a record (one person or event) and each column is a variable (one attribute, such as price or date). Values, plus a schema and metadata, turn a loose pile of data into a usable dataset.
Think of a dataset as data with a job to do. A list of product prices from one online store, captured on the same day, is a dataset. Mix those prices with weather readings and customer emails, and you no longer have one. Nothing ties the pieces together, so you can't analyze them as a single unit.
You can get a dataset in two ways. Download one that someone else has prepared, or build your own from internal records, APIs, or public web pages. Building your own is where Proxy-Cheap comes in, so the next section walks through how that works.
| Part of a tabular dataset | What it means |
|---|---|
| Row (record or observation) | One entry, such as a single customer order |
| Column (variable or attribute) | One type of information, such as order date or amount |
| Cell (value) | The data point where one row meets one column |
| Header | The column names that describe each variable |
Many modern datasets are built from publicly available web data. Teams gather it in a few ways: internal exports, official APIs, and large-scale collection of public pages. For large collection jobs across many regions, proxies route requests through residential or datacenter IPs so a project can gather region-specific data reliably and stay within each site's rate limits.
Whatever the source, most datasets travel the same path from raw input to finished file. We call it the dataset lifecycle, and it has five stages:
Collection decides everything after it. If the raw data is thin or skewed, no amount of cleaning will save it. There are three common routes.
Internal exports. Your CRM or store backend can export records as CSV or JSON. It's the easiest route because you already own the data. The catch is that it only shows your own side of the market.
Official APIs. Many platforms publish APIs that return clean, documented JSON. That saves parsing work. But an API only exposes the fields its provider chooses, and most cap how many requests you can send per minute or per day.
Public web pages. When the data you need sits on public websites (prices, product listings, job ads), automated web data collection turns those pages into rows. A script requests each page, parses the fields you care about, and writes them into your structure.
This third route is where proxies earn their place. A single server sending thousands of requests from one IP soon runs into per-IP rate limits. It also only sees the version of a page served to its own location. Routing requests through a pool of IPs spreads the load and lets you collect the region-specific version of each page.
Each proxy type fits a different job. Rotating residential proxies suit broad, multi-region collection, with 180+ locations and country and city targeting. Static residential (ISP) IPs suit session-persistent jobs that need the same address for days. Datacenter IPs suit high-throughput collection of public pages such as catalogs and documentation.
Keep collection responsible: gather only publicly available data and pace your requests in line with each site's terms. If you manage proxies from code, the Proxy-Cheap API documentation covers ordering proxies and rotating IPs through a REST API. For the wider concept of an intermediary in front of an API, see our explainer on the proxy API.
Datasets fall into three broad structural types. Structured datasets sit in rows and columns and are easy to query with SQL or Excel. Semi-structured datasets, such as JSON or XML, carry tags and nested fields instead of a fixed table. Unstructured datasets hold raw files such as images and video. Datasets are also grouped by other axes, such as labeled versus unlabeled or open versus private.
| Type | Structure | Example |
|---|---|---|
| Structured | Rows and columns, fixed schema | Spreadsheet of customer orders |
| Semi-structured | Tags / nested fields | JSON or XML file |
| Unstructured | Raw files, no table | Images, video, audio, documents |
Web collection projects often pass through all three. Raw HTML gets parsed into JSON fields, which then become a structured table you can load into a spreadsheet or database.
Structure is only one way to sort datasets. Four other groupings come up all the time.
A dataset is one collection of related data prepared for a specific analysis or project. A table is the rows-and-columns layout that structured data sits in. A database is a system that stores and queries many tables or datasets over the long term. In short: a database can hold many datasets, and a dataset can be presented as one or more tables.
| Dataset | Table | Database | |
|---|---|---|---|
| What it is | A prepared collection of related data | A rows/columns layout | A system that stores and queries data |
| Scope | One analysis or project | One structured view | Long-term, many datasets |
Picture an online store. Its database holds dozens of tables, from customers to payments. An analyst exports last quarter's orders, joined with product categories, to study seasonal demand. That export is a dataset: it exists to answer one question, and it can live outside the database as a single CSV file.
Spreadsheets and APIs work the same way. Both can contain a dataset, but neither is a dataset by itself.
A dataset has a few defining parts. Variables (also called attributes or features) are the columns, each holding one type of information such as age or revenue. Records (also called observations) are the rows, each a single entry. A schema defines the structure and the relationships between fields, and metadata describes the data's source and quality.
Say you collect product prices from public store pages. The variables might be product name, store, country, price, currency, and collection date. Each record is one product, seen in one store, on one day.
The schema sets the rules for each field. Price is a decimal number, currency is a three-letter ISO code, and the date follows YYYY-MM-DD. Without those rules, one file holds "19.99" and another "$19,99", and your averages stop making sense.
Metadata tells a newcomer where the data came from and when it was collected. It also records which license applies. It's the difference between a file you can trust and one you have to reverse-engineer. If you publish datasets, standard vocabularies such as Schema.org's Dataset type and the W3C's DCAT help search engines and data catalogs find them.
Analysts summarize a dataset with a few core measures. The mean is the average of the values. The median is the middle value once the numbers are ordered. The mode is the value that appears most often.
The range is the largest value minus the smallest. An outlier is a value that sits far from the rest and may signal an error or a rare event.
Let's run all five on one small sample: a shop's daily order count over one week. The values are 2, 4, 4, 6, 8, 10, and 36.
That gap matters. One big day drags the average up, so check any outlier before you trust a mean. It might be a real event, like a flash sale. Or it might be an error, like a duplicated order or a parser that read a price wrong.
Datasets are the raw material for analysis and decision-making. In machine learning and AI, they train and validate models, including the large language models behind today's chatbots. In business intelligence, they feed dashboards and reports. In research, they support hypothesis testing and pattern finding across fields like finance and healthcare.
AI is the fastest-growing field. Computer vision models learn from labeled images, while large language models train on massive text collections, including public web pages. Teams usually split one dataset into training, validation, and test sets, so they can check a model on data it hasn't seen.
That shift is changing how companies treat data. A Gartner survey cited in IBM's dataset overview found that 61% of organizations had to evolve or rethink their data and analytics operating model because of AI technologies.
Outside AI, datasets do steady work in every industry. In finance, transaction histories help train fraud detection models. In healthcare, de-identified patient records support studies on treatment outcomes. In marketing, market research teams compare competitor offers across countries, while price monitoring tracks day-to-day price changes. Agencies run ad verification to confirm ads display correctly in each market, and SEO teams rely on SEO data gathering to compare rankings country by country.
You can either download a ready-made dataset or build your own. Public repositories like Kaggle, the UCI Machine Learning Repository, Data.gov, and the EU Open Data Portal offer free datasets across most fields. When no public dataset fits, teams build their own from publicly available web data, then clean and structure it for use.
Here's where to look first:
Before you use an open dataset, read its license. Some allow commercial use; others don't.
Public repositories are great for learning and benchmarks. But they're often months or years old, and they rarely cover the exact products or region you need. That's when building your own makes sense. For high-throughput collection of public pages, datacenter proxies offer dedicated IPv4 and IPv6 addresses with unlimited bandwidth. For long jobs that need a steady residential address, ISP proxies pair a fixed IP with consistent connection speeds.
Need data no repository has? You can build a dataset from publicly available web sources. Proxy-Cheap offers rotating residential, static residential, ISP, and datacenter IPs, with pay-as-you-go pricing for rotating residential, so you can collect region-specific data at dataset scale. No set-up costs, cancel anytime.
A good dataset is judged on a few criteria. Check completeness (no important fields missing), consistency (uniform formats and units), and accuracy (values that match a trusted source). Then weigh timeliness and representativeness, plus how ethically the data was gathered. A current, well-documented, representative dataset produces more reliable analysis than a large but messy one.
Completeness is easy to measure: count the empty values in each column. If 30% of your price field is blank, any average you calculate is shaky. For accuracy, pull a random sample of records and check them against the original source.
Timeliness depends on the question. Last year's prices tell you little about today's market, which is why dynamic datasets need continuous collection. For daily refresh jobs that move a lot of data, unlimited bandwidth proxies take per-GB costs out of the calculation.
Representativeness asks whether your sample matches the group you want to describe. Prices from one country can't describe a global market. On ethics, stick to publicly available data and follow privacy rules like GDPR when personal data is involved.
Missing values and hidden bias are the most common headaches. Privacy obligations and scalability tend to show up as a dataset grows.